What Do Japanese Households Spend Their Money On? Consumer Trends and Business Insights

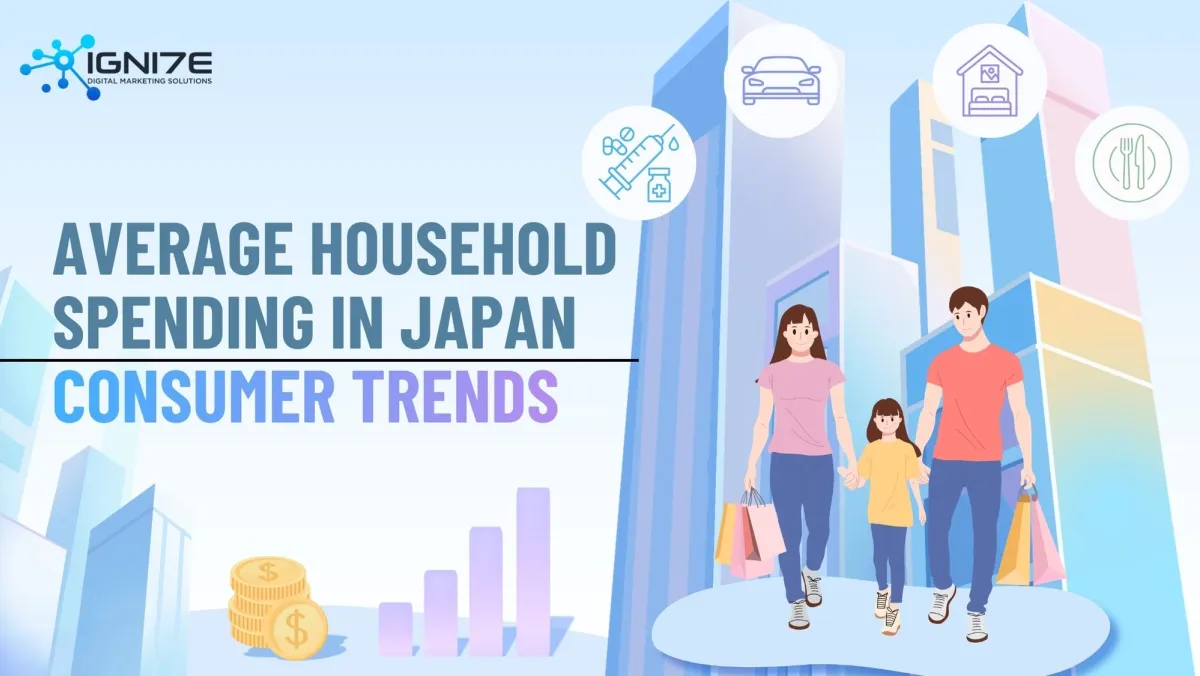
Household spending trends are fundamental data not only for personal financial planning but also for corporate marketing strategies and market analysis.
Statistical data, such as the Family Income and Expenditure Survey conducted by Japan’s Statistics Bureau, provides detailed insight into how Japanese households allocate their spending. Expense categories such as food, housing, education, and entertainment offer valuable insights into consumer behavior and spending patterns.
This article provides a comprehensive overview of household spending in Japan, examining average spending levels, long-term trends, monthly fluctuations, demographic differences, and practical ways businesses can leverage spending data.
How Much Do Japanese Households Spend? A Look at the Latest Spending Data
Understanding how much Japanese households spend each month is the first step toward gaining a clear picture of overall consumer spending. Based on the Family Income and Expenditure Survey published monthly by the Japanese government, let’s take a look at the latest spending figures.
Average Household Spending in Japan (Monthly and Annual)
According to the 2024 Family Income and Expenditure Survey, average monthly consumption expenditure was approximately ¥184,000 for single-person households and approximately ¥325,000 for households with two or more members. On an annual basis, average consumption expenditure amounted to roughly ¥2.3 million for single-person households and ¥3.9 million for households with two or more members.
Although spending levels vary depending on income and region, it is not uncommon for households with two or more members to spend more than ¥4 million per year.
In addition, non-consumption expenditures—such as taxes and social insurance premiums—averaged ¥96,289 per month, accounting for approximately 17.7% of household income.
Trends in Household Spending in Japan (Historical Overview)
Household spending in Japan has evolved in response to economic conditions, social changes, and government policies. The following sections outline how spending patterns have changed over time.
The 2000s: Stable Spending Under Deflation
The 2000s followed Japan’s post-bubble “Lost Decade,” a period during which consumer confidence remained subdued. Amid ongoing deflation, household consumption expenditures generally remained flat or declined gradually.
One of the defining characteristics of the period was the widespread adoption of a savings-oriented mindset. Consumers became increasingly price-conscious, as evidenced by the rise of private-label supermarket products and the nationwide expansion of 100-yen stores.
According to the Family Income and Expenditure Survey, average monthly consumption expenditure for households with two or more members remained in the ¥290,000–¥300,000 range throughout much of the 2000s.
The 2010s: Gradual Recovery and Shifting Spending Patterns
The 2010s marked a period of gradual economic recovery under the economic policies commonly known as Abenomics, which began in late 2012. Supported by improving employment conditions and rising wages, some households experienced growth in disposable income, contributing to a recovery in consumer spending.
Survey data shows that average monthly consumption expenditure for households with two or more members increased from approximately ¥280,000 in 2011 to around ¥310,000 in 2019.
At the same time, increases in the consumption tax—from 5% to 8% in April 2014 and from 8% to 10% in October 2019—raised the financial burden on households. These tax hikes repeatedly led to surges in spending before implementation and declines in consumption afterward.
Spending patterns also shifted significantly during the 2010s. The rapid adoption of smartphones drove substantial growth in spending on telecommunications and digital services. In addition, consumers began placing greater value on experiences, fueling the rise of experience-based consumption.
Early 2020s: Spending Changes During the COVID-19 Pandemic
The COVID-19 pandemic brought dramatic changes to household spending patterns in Japan during the early 2020s.
In 2020, average monthly consumption expenditure for households with two or more members was approximately ¥280,000. Restrictions on movement, states of emergency, and shortened restaurant operating hours led to sharp declines in spending on dining out, entertainment, and transportation.
At the same time, spending increased in categories associated with stay-at-home lifestyles, including groceries, delivery services, consumer electronics such as computers and monitors, and telecommunications services.
Travel and leisure spending contracted significantly between 2020 and 2021, severely affecting the tourism, hospitality, and aviation sectors. Meanwhile, government initiatives such as Go To Travel and Go To Eat temporarily helped stimulate consumer spending.
Late 2020s: Inflation and Changes in Real Consumption
Since 2022, global inflationary pressures have increasingly affected Japan, creating a new phase in household spending. Rising energy prices, yen depreciation, and higher raw material costs have driven significant increases in food and utility prices.
While nominal household spending has risen, real consumption expenditure—adjusted for inflation—has remained flat or even declined during certain periods.
In such an environment, consumers have once again become more cost-conscious, placing greater emphasis on value for money. As a result, demand for private-label products and discounted goods has continued to grow.
Monthly Spending Patterns in Japan
Let’s take a closer look at how household spending changes throughout the year.
January–March: New Year Spending and Winter Expenses
January typically sees higher spending due to New Year sales and lucky bags (fukubukuro), while winter utility costs remain elevated. Additional expenses such as New Year gift money, holiday dining, and travel to hometowns also contribute to increased spending.
February is generally a relatively quiet month for household spending, although food and gift purchases related to Valentine’s Day provide a modest boost.
March coincides with the end of the fiscal and academic years, resulting in expenses related to job transfers, moving, and graduation. It is also tax filing season, resulting in tax-related payments for many households.
April–June: Higher Spending on New Beginnings and Education
April marks the start of a new fiscal and academic year, bringing expenses related to school enrollment, new jobs, and the beginning of a new school term. Spending typically includes uniforms, school supplies, business attire, and household appliances. For families with children, educational startup costs can be especially high.
May sees increased spending on travel, leisure activities, and dining out during Golden Week. Domestic travel and visits to family often result in substantial expenditures, making travel and entertainment among the highest-spending categories of the year.
In June, the rainy season tends to reduce outdoor activities, leading to lower entertainment spending. At the same time, some households tighten their budgets in anticipation of summer bonus payments.
July–September: Rising Leisure and Utility Costs
July marks the start of summer vacation-related spending. Travel reservations, beach and outdoor recreation purchases, and travel to hometowns begin to increase, while utility bills rise due to increased air conditioning use.
August is typically the month with the highest utility expenses of the year, as electricity costs increase significantly. Spending on travel, family visits, and Obon-related activities also peaks, pushing the entertainment and travel categories to their annual highs.
In September, summer-related spending begins to subside, while purchases of fall clothing and expenses related to school sports days and other events start to increase. Utility costs generally decline from August levels, although typhoon season can sometimes generate unexpected housing-related expenses.
October–December: Year-End Shopping and Seasonal Events
October brings increased spending on Halloween-related food, costumes, and events. As it also coincides with the autumn travel season, spending on travel, dining, and leisure remains steady. Clothing expenditures also rise as consumers transition to fall and winter wardrobes.
In November, the growing popularity of Black Friday has led to a surge in purchases of electronics, fashion items, and household goods. It is also the time when consumers begin purchasing food, alcoholic beverages, and gifts in preparation for the year-end holiday season.
December is the busiest spending month of the year, driven by Christmas celebrations, year-end gatherings, gift-giving traditions, and New Year preparations. Spending increases across virtually all categories, including dining, groceries, gifts, travel, and entertainment.
Differences in Household Spending by Demographic Segment
Next, let’s examine how household spending varies across different demographic groups.
Household Spending by Income Level
Household spending patterns differ significantly according to income.
Annual Income Below ¥3 Million: Spending Focused on Essentials
Among households earning less than ¥3 million annually, the majority of spending is allocated to necessities such as food, housing, utilities, and telecommunications. These households tend to have a high Engel coefficient, meaning food accounts for a relatively large share of total expenditures, while spending on entertainment, dining out, and travel is often limited.
Because financial flexibility is limited, these households generally demonstrate strong cost-saving behavior, including using private-label products, discounted goods, and flea-market apps.
Demand for reducing fixed expenses such as insurance and telecommunications costs is also high, making these households particularly receptive to low-cost mobile plans and mutual-aid insurance programs.
Annual Income of ¥3 Million–¥6 Million: A Balanced Spending Structure
Households earning between ¥3 million and ¥6 million annually represent the largest segment of Japanese households. Their spending patterns are characterized by a balance between essential expenses and discretionary spending on education, leisure activities, and dining out.
Mortgage repayments often place pressure on household finances, and for families with children, balancing housing costs and educational expenses can be a major challenge. While these households are willing to spend on travel, dining, and entertainment, they are generally price-sensitive and place strong emphasis on value for money.
Annual Income Above ¥6 Million: Greater Discretionary Spending
For households earning more than ¥6 million annually, essential living expenses tend to account for a smaller share of total income, allowing more resources to be allocated toward discretionary spending categories such as travel, dining, hobbies, education, investments, and luxury goods.
Consumers earning above ¥6 million per year often prioritize quality, branding, and overall experience over price. As a result, they tend to be more receptive to premium products and high-value services. They are also more likely to actively consider options such as private schools, extracurricular programs, and overseas study opportunities for their children.
Consumer Spending Characteristics by Age Group
Spending patterns also vary considerably across age groups.
Consumers in Their 20s and 30s: Focused on Self-Investment and Leisure
Consumers in their 20s and 30s generally have lower incomes but strong spending intentions for self-development, entertainment, dining out, travel, and fashion. They are highly receptive to subscription services, social media-driven purchases, and experience-oriented consumption, and they typically devote a larger share of their budgets to digital services than older generations.
By their late 30s, major life events such as marriage, childbirth, and homeownership often lead to sharp increases in fixed expenses. Another defining characteristic of consumers in their 20s and 30s is their susceptibility to social media reviews and influencer recommendations.
Consumers in Their 40s and 50s: Higher Education and Housing Costs
Consumers in their 40s and 50s often reach their peak earning years while simultaneously facing major financial obligations, including children’s education, mortgage payments, and eldercare responsibilities.
Particularly from the late 40s through the 50s, university tuition costs can place significant pressure on household finances. Spending on education, student loans, tutoring services, and preparatory schools often represents a substantial share of household budgets. At the same time, retirement planning becomes increasingly important, leading to greater spending on investments, insurance products, and iDeCo retirement savings accounts.
Consumers in their 40s and 50s generally possess strong purchasing power and tend to favor mid- to high-priced products that emphasize quality. Brand loyalty is also relatively strong, resulting in higher rates of repeat purchases for favored products and services.
Consumers Aged 60 and Over: Focused on Healthcare and Daily Living
Among consumers aged 60 and over, pension income increasingly becomes the primary source of household earnings. Spending tends to concentrate on essentials such as food, utilities, healthcare, and housing maintenance.
Out-of-pocket medical expenses, health supplements, and long-term care-related services also account for a growing share of spending.
At the same time, households that are no longer burdened by child-rearing costs or mortgage payments may enjoy greater financial flexibility, allowing for more discretionary spending on travel, hobbies, and gifts for grandchildren.
Comparison by Household Size (Single-Person vs. Family Households)
Next, let’s compare spending patterns among single-person households, two-person households, and households with children.
Single-Person Households: A Relatively High Fixed-Cost Burden
Single-person households must bear expenses such as rent, utilities, telecommunications, and insurance premiums on their own, resulting in a higher proportion of income being allocated to fixed costs. Compared with larger households, they are more likely to experience diseconomies of scale, meaning their per-person cost of living is relatively higher.
Food expenses also tend to be less efficient because bulk purchasing and meal preparation are more difficult. As a result, single-person households often rely more heavily on smaller package sizes, dining out, and ready-made meals. They are frequent users of convenience stores and prepared foods, and generally have a strong affinity for food delivery services.
Two-Person Households: A More Efficient Spending Structure
Because living expenses can be shared, two-person households benefit from lower per-person fixed costs and often have higher disposable income. This segment, often referred to as DINKs (Double Income, No Kids), tends to spend actively on travel, dining, and hobbies, making it an important consumer segment.
Two-person households can also take advantage of moderate bulk purchasing, improving efficiency in spending on food and household necessities. Dual-income households, in particular, tend to spend more on convenience-oriented services such as meal delivery, housekeeping, and takeout.
Households with Children: Rising Education and Living Costs
The arrival of children significantly increases household expenses across a wide range of categories, including food, clothing, healthcare, education, and childcare. During infancy and early childhood, daycare and nursery school costs can represent a major financial burden. At the same time, tutoring, extracurricular activities, and educational materials become additional expenses once children reach school age.
Consumer spending patterns among households with children vary considerably with the number and ages of children. Typical expenses include baby products, formula, and diapers during infancy; toys, picture books, and extracurricular lessons during early childhood; school supplies, tutoring services, and sports equipment during the school years; and entrance examinations and higher-education costs during high school and university preparation. As children progress through each stage of development, household spending patterns evolve accordingly.
Breakdown of Household Consumption Expenditures in Japan by Category
In this section, we examine how household consumption expenditures are distributed across spending categories in Japan.
Major Spending Categories: Food, Housing, Utilities, and More
The primary categories of household spending in Japan are as follows.
- Food: Food represents the largest share of household consumption expenditures. Among households with two or more members, approximately ¥90,000 per month is spent on food. Spending on dining out and prepared foods (such as deli items and ready-made meals) has been rising steadily over the years.
- Housing: For people in their 20s and 30s, as well as single-person households, monthly rent typically ranges from ¥20,000 to ¥40,000. In contrast, households that own their homes or have fully paid off their mortgages generally incur only maintenance and management costs, resulting in housing expenses of approximately ¥10,000 to ¥20,000 per month.
- Utilities and Water: Average monthly utility and water expenses range from roughly ¥10,000 to ¥20,000. However, heating and cooling costs can push monthly expenses above ¥30,000 during the winter and summer months. Rising electricity and gas prices in recent years have increased the financial burden of utilities on household budgets.
- Transportation and Communications: Average monthly spending in transportation and communications is approximately ¥20,000 to ¥30,000 for single-person households and ¥40,000 to ¥60,000 for households with two or more members. Major expenses include smartphone and internet service fees, as well as vehicle-related costs such as gasoline, insurance, and parking.
- Education: For households with children, education-related expenses can range from several tens of thousands of yen to more than ¥100,000 per month. The share of educational expenses in the household budget varies considerably depending on factors such as the number of children and the region where the family lives.
Household Spending Category Rankings in Japan
When the consumption expenditures of households with two or more members are broken down by percentage, the rankings generally appear as follows:
1st: Food (approximately 23–27%)2nd: Transportation and Communications (approximately 10–15%)3rd: Culture and Recreation (approximately 11–13%)4th: Utilities and Water (approximately 6%)5th: Healthcare (approximately 4–5%)6th: Housing (approximately 3–4%)7th: Clothing and Footwear (approximately 3–4%)8th: Furniture and Household Goods (approximately 3%)9th: Education (approximately 0–3%)
Fixed and Variable Expense Ratios
Household consumption expenditures can generally be divided into two categories: fixed expenses, which remain relatively constant from month to month, and variable expenses, which fluctuate depending on circumstances.
Major fixed expenses include housing costs (rent or mortgage payments), communication expenses, insurance premiums, subscription services, and parking fees. These expenses are estimated to account for approximately 40–50% of monthly household spending.
Variable expenses include food, utilities, social activities, entertainment, clothing, and medical costs. These expenditures can vary significantly depending on the season, special events, and family circumstances. Effective household budgeting generally begins with understanding and reducing fixed expenses, followed by managing variable expenses.
Key Characteristics of Household Spending in Japan: Consumer Trends and Structural Factors
Let’s examine some of the defining characteristics of household spending in Japan.
Household Spending Trends in Japan
Several notable patterns can be observed in Japanese household spending behavior.
Education Accounts for a Large Share of Household Budgets
Japanese households place a strong emphasis on educational investment, and the share of education-related spending within household budgets is among the highest in OECD member countries.
In addition to school-related expenses, many families spend heavily on cram schools, preparatory schools, and extracurricular lessons. In particular, households preparing their children for private junior high school or university entrance exams often spend more than ¥1 million per year on education.
High Insurance Spending Reflects a Strong Preference for Risk Avoidance
Japanese households are also known for their relatively high spending on insurance. Many families carry a range of policies, including life, medical, cancer, fire, and automobile insurance. It is not uncommon for households to spend tens of thousands of yen per month on insurance premiums.
It reflects the strong risk-averse mindset of many Japanese consumers, as well as concerns about future financial security and retirement-related expenses. As confidence in the social security system grows less certain, many individuals continue to rely on insurance to protect themselves against potential risks.
Spending on Communications and Digital Services Remains Consistently High
The widespread adoption of smartphones, the rollout of 5G networks, and the growing variety of streaming services have led to a steady increase in spending on communications and digital services.
Many households subscribe to multiple digital services at the same time, including video and music streaming platforms, online games, e-books, and cloud storage services. As a result, digital spending is increasingly becoming a fixed household expense.
Dining Out and Entertainment Spending Are Often the First to Be Reduced
When economic uncertainty rises or concerns about future income increase, Japanese consumers tend to cut discretionary spending first, particularly in categories such as dining out, entertainment, and travel.
The tendency to maintain spending on necessities while reducing spending on leisure and luxury-related activities reflects the frugal mindset commonly associated with Japanese households.
How Population Aging and the Rise of Single-Person Households Are Changing Spending Patterns
Population aging and the growing number of single-person households are reshaping household spending structures in several important ways.
The Growth of Single-Person Households Increases Per-Capita Spending
Japan’s household structure is becoming increasingly centered around single-person households. According to the 2020 Population Census, single-person households accounted for more than 38% of all households, and the figure is expected to continue rising.
Because living costs cannot be shared among multiple household members, single-person households tend to have lower spending efficiency per person, resulting in relatively higher living expenses.
The shift has increased demand for products and services tailored to individuals, contributing to the growth of markets such as smaller food package sizes, single-person appliances, housing designed for solo residents, and food delivery services geared toward people who dine alone.
Healthcare and Wellness Expenses Are Becoming More Important for Older Households
Japan’s population is aging at one of the fastest rates in the world, and the share of households headed by individuals aged 65 and older continues to rise. As the population ages, spending on healthcare, prescription medications, long-term care services, and health-related products accounts for an increasingly larger portion of household budgets.
Changes to social welfare programs, including revisions to the healthcare system for elderly citizens and increases in out-of-pocket costs for long-term care insurance, are also affecting household finances. As a result, continued growth in healthcare- and caregiving-related expenditures is widely expected.
Housing and Utility Costs Can Place a Significant Burden on Household Budgets
Both single-person and elderly households tend to devote a larger share of their income to fixed expenses such as housing and utilities.
In particular, elderly individuals living alone often need to cover housing, utility, and medical expenses primarily through pension income, leaving very little disposable income available for other spending.
Consumption Is Shifting from Mass Consumption to Individualized Consumption
The increase in single-person households and the aging of the population are driving consumer spending toward smaller-scale, more diverse, and increasingly personalized patterns.
Rather than purchasing large-volume products designed for large families, consumers are increasingly seeking products and services tailored to their personal preferences, health conditions, and lifestyles.
The Impact of Inflation and Cost-Conscious Consumer Behavior on Household Spending
Inflation and growing cost-consciousness among consumers are influencing household spending in several key ways.
Inflation Raises Nominal Spending While Constraining Real Consumption
Since 2022, inflation has led to significant increases in the prices of food, energy, and other essential goods.
Although nominal household spending reported in the Family Income and Expenditure Survey has increased compared with the previous year, real consumption expenditure—after adjusting for inflation—has remained flat or declined. In other words, households are often paying more while receiving the same quantity and quality of goods and services, or even less than before.
Essential Expenses Such as Food and Utilities Account for a Larger Share of Spending
The effects of inflation are most directly reflected in the prices of necessities such as food and utilities. Even if total household spending remains unchanged, higher spending on essentials reduces the amount of money available for other categories.
The rise in the Engel coefficient (food expenditure divided by total consumption expenditure) is a clear example of the trend.
Discretionary Spending on Entertainment and Dining Out Is More Likely to Be Reduced
When inflation places pressure on household budgets, discretionary expenditures such as dining out, travel, entertainment, and fashion are often the first to be cut.
For businesses in the food service, tourism, and entertainment sectors, it can result in lower spending per customer and fewer visits.
Greater Emphasis on Price and Value for Money
During periods of inflation, consumers become increasingly price-sensitive and are more likely to choose lower-priced alternatives when product quality is perceived to be similar.
Cost-saving behaviors become more common, including switching to private-label (PB) products, buying in bulk, maximizing loyalty points, and using price-comparison websites. Consumers are increasingly willing to invest time and effort in finding the best value.
From a business perspective, while competitive pricing becomes increasingly important, companies must also establish clear value-added differentiation to avoid competing solely on price.
How Household Spending in Japan Compares Internationally
Compared with households in the United States, the United Kingdom, and many other OECD economies, Japanese households display several distinctive spending patterns shaped by the country’s social structure, transportation infrastructure, and demographic trends.
One notable characteristic is the relatively high financial burden borne by households for education. While public education spending in Japan is lower than the OECD average in some areas, households often make substantial out-of-pocket investments in private education, including cram schools (juku), tutoring, and extracurricular lessons. As a result, education-related expenses can represent a significant portion of household budgets, particularly for families with school-age children.
Japanese households also tend to allocate a considerable amount of money to insurance products. Life insurance, medical insurance, and other forms of private coverage are widely used, reflecting a strong preference for financial security and risk management.
Housing costs present a more nuanced picture. In major metropolitan areas such as Tokyo, housing expenses can be substantial. However, on a national level, the share of household spending devoted to housing is often lower than in many Western countries, particularly among households that own their homes or have already paid off their mortgages.
Japan’s extensive public transportation network also influences transportation spending. In many urban areas, households can rely on rail and bus systems rather than private vehicles, reducing expenses related to car ownership, fuel, insurance, and parking compared with countries with higher automobile dependence.
Finally, Japan’s rapidly aging population continues to reshape consumption patterns. As the share of older households increases, spending on healthcare, pharmaceuticals, wellness products, and long-term care services is becoming a larger component of overall household expenditure. Japan’s demographic shift is expected to remain one of the most important drivers of consumer spending trends in the years ahead.
How Businesses Can Use Japanese Household Spending Data
The following are key ways businesses can use household spending data in Japan.
1. Understand Market Size and Growth Opportunities to Support Market Entry and Investment Decisions
Household spending data is a fundamental resource for understanding market sizes and identifying growth trends across spending categories.
For example, if spending on healthcare and wellness continues to expand as the population ages, it can provide a strong basis for prioritizing investment or market entry in those sectors.
By combining household expenditure data with industry and demographic statistics, businesses can identify markets expected to grow over the next decade as well as those likely to contract. These insights can help prioritize investment targets and new business opportunities.
2. Use Spending Patterns to Develop Effective Products and Pricing Strategies
Understanding spending patterns by category, income level, and age group provides valuable insights for designing products and determining pricing strategies that align with the needs of target customer segments.
For example, if households earning less than ¥3 million annually allocate a large share of their budgets to food and utilities and have limited disposable income, products aimed at this segment can be positioned around affordability, strong value for money, and cost-saving benefits.
Monthly spending fluctuation data can also be used to support promotional planning. By aligning campaigns, inventory management, and advertising investments with periods of higher demand—such as the new-school and new-work season in April, year-end shopping in December, and leisure-related spending in August—companies can improve the efficiency of their marketing investments.
3. Identify Customer Segments and Develop Positioning Strategies
Spending data provides insight into which customer groups are spending, what they are spending on, and how much they are spending. As such, it can be used to identify customer segments and develop effective market positioning strategies.
Because spending patterns vary significantly by income level, age group, household composition, and region, identifying the customer segments that derive the greatest value from a company’s products or services is a fundamental element of effective marketing.
By connecting changes in spending behavior with broader social trends—such as the rise of single-person households, population aging, and the growth of dual-income households—companies can more easily anticipate evolving consumer needs and develop products and services that address those changes.
Conclusion: Understanding Japanese Household Spending for Data-Driven Strategic Decision-Making
This article has provided a detailed overview of average household spending levels in Japan, long-term spending trends, monthly fluctuations, demographic differences, category-specific spending patterns, key consumer behavior characteristics, and practical business applications.
Japanese household spending is undergoing a major transformation driven by structural changes, including population aging, the growth of single-person households, inflation, and digitalization. For modern market analysis, it is essential not only to monitor changes in nominal spending but also to understand shifts in real purchasing power, household structures, and consumer values.
Regularly monitoring official statistics, including the Family Income and Expenditure Survey published by Japan’s Ministry of Internal Affairs and Communications, and incorporating these insights into business strategy can provide a strong foundation for informed decision-making.
Frequently Asked Questions

According to the 2024 Family Income and Expenditure Survey, average monthly consumption expenditure was approximately ¥184,000 for single-person households and approximately ¥325,000 for households with two or more members. Average annual consumption expenditure was approximately ¥2.3 million for single-person households and ¥3.9 million for households with two or more members.
However, actual spending levels vary significantly depending on household income, composition, and location.
The main spending categories are food (approximately 23–27%), transportation and communications (approximately 10–15%), culture and recreation (approximately 11–13%), utilities and water (approximately 6%), healthcare (approximately 4–5%), and housing (approximately 3–4%).
Average household consumption expenditure refers to the average amount obtained by dividing the total consumption expenditure of all households nationwide by the total number of households.
This figure is published regularly through the Family Income and Expenditure Survey conducted by the Ministry of Internal Affairs and Communications. It is widely used as a key indicator for tracking economic conditions, price fluctuations, and changes in consumer behavior.
Months with higher spending levels include December (year-end shopping, Christmas, and bonus-related spending), August (Obon holidays, travel, and higher utility costs), April (new-life-related expenses), and May (Golden Week).
Spending tends to be relatively lower in February, June, and the first half of November. However, in recent years, spending in November has also been increasing due to the growing popularity of Black Friday sales.
On a nominal basis, household spending has generally been increasing since 2022 due to rising prices.
However, real consumption expenditure—after adjusting for inflation—has remained flat or declined during certain periods. As a result, it is important to note that actual consumption levels and household purchasing power have not necessarily improved.
Rising prices for essential goods and services, such as food and utilities, have increased the share of household budgets allocated to necessities.
As a result, discretionary spending on categories such as entertainment, dining out, and travel is more likely to be reduced, while consumers have become increasingly focused on value for money.
Average monthly consumption expenditure is approximately ¥170,000–¥180,000 for single-person households, compared with roughly ¥340,000 for family households consisting of parents and children.
However, single-person households generally face a higher per-person fixed-cost burden and tend to benefit less from economies of scale than households with two or more members. As household size increases, per-person spending generally declines.
The four primary applications are:
- Making market entry and investment decisions by assessing market size and growth opportunities;
- Developing product designs and pricing strategies based on spending patterns across different categories;
- Identifying customer segments and establishing market positioning using demographic spending data;
- And planning promotional campaigns based on monthly fluctuations in household spending.
Project manager leading Japanese content initiatives across SEO, social media, and creative production. Leads teams and collaborates with clients to deliver content projects.